")
Gantt Charts Through the Lens of Primavera
Project schedules can feel overwhelming. Yet, the humble Gantt Charts in Primavera brings clarity. When paired with Primavera (especially P6), a Gantt chart becomes a powerful tool for planning, tracking, and communicating your project trajectory. In this article, you’ll get a deep, practical understanding of Gantt charts in Primavera. We’ll walk through what they are, why they matter, how Primavera handles them, best practices, and common pitfalls.
Gantt Charts in Primavera
1. Understanding Gantt Charts and Their Value
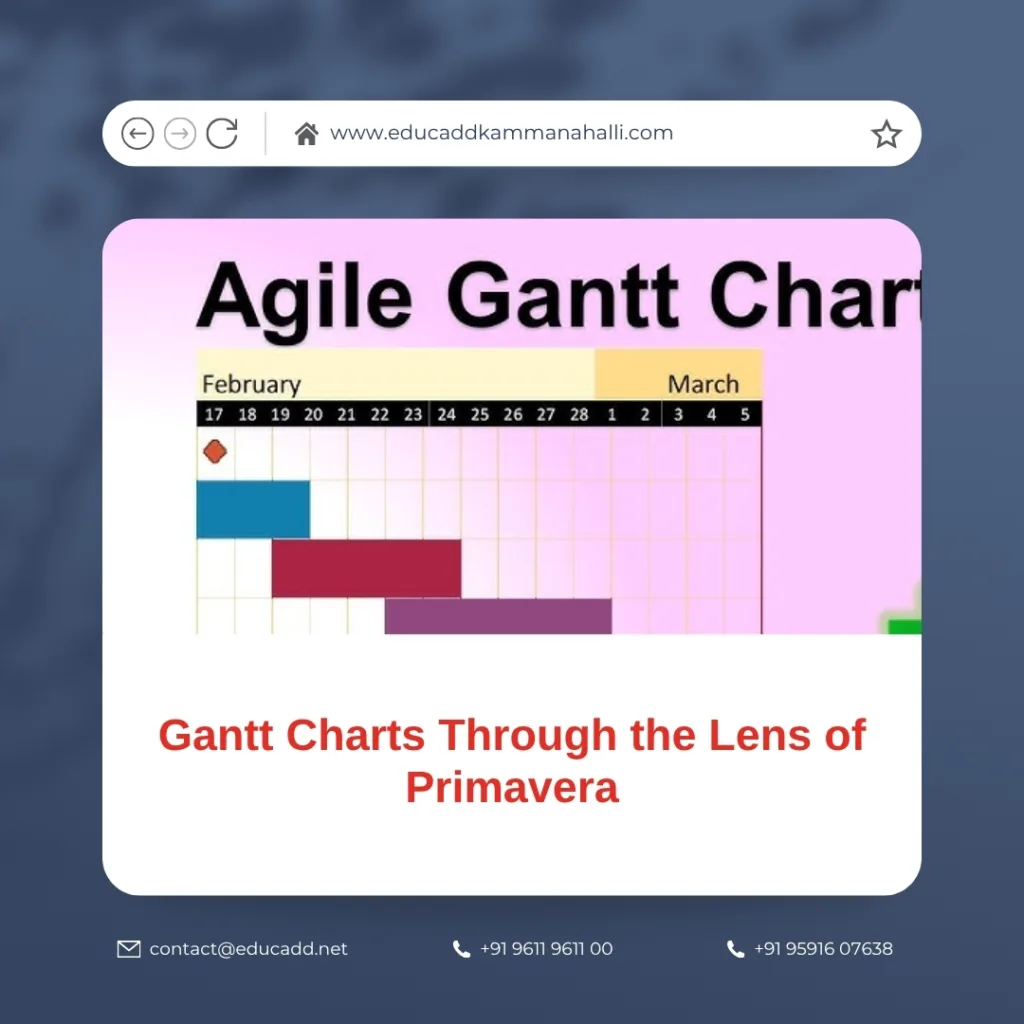
A Gantt Charts in Primavera is a bar-chart timeline that displays activities (tasks) along the vertical axis, and time along the horizontal. Each bar shows the start and finish dates of the associated activity. Modern Gantt charts also depict dependencies, progress, and relationships.
Why use a Gantt chart? Because they:
-
Provide an intuitive visual for project schedule
-
Help identify overlaps, free float, and bottlenecks
-
Let stakeholders see progress at a glance
-
Facilitate updates and comparison between baseline and actuals
But a plain Gantt chart can be limiting when the project grows large. That’s where Primavera adds sophistication.
2. How Primavera Uses & Enhances Gantt Charts
In Primavera P6, the Gantt chart is central to scheduling and tracking. But Primavera layers on features that make Gantt charts smarter. Below are key capabilities and behaviors:
2.1 Bars, relationships, and driving logic
In Primavera, driving relationships (dependencies that directly determine an activity’s dates) appear as lines linking bars. Critical path relationships may be shown in red, non-critical in black or default. The bars themselves are configurable: you can show baselines, current, and secondary schedules side by side.
2.2 Timescale, zoom, and shading
You can zoom your Gantt chart at different time scales (days, weeks, months) and adjust what is visible. Primavera supports shading non-workable time (weekends, holidays) based on the project calendar to improve clarity.
2.3 Printing or exporting Gantt views
Primavera gives you printing layouts that combine the activity table and Gantt side by side. By configuring timescale start/finish and fit settings, you can export to PDF or XPS formats cleanly.
2.4 Advanced display techniques
You can display two Gantt charts side by side in Primavera by using the “Additional Activities View” and vertical tab groups. Also, Primavera can display hourly Gantt charts (for very short or precision tasks) if you configure durations at hour/minute levels.
Thus, Primavera doesn’t just draw bars; it gives you flexible, dynamic views to match your project scale and reporting needs.
3. Step-by-Step: Building a Gantt Chart in Primavera
To really grasp how Gantt charts operate in Primavera, let’s walk through a stepwise approach. At each step, I’ll note what to do in Primavera.
Step 1: Define the scope & build the WBS
First, you need a clear project scope. Break that into a Work Breakdown Structure (WBS)—hierarchical deliverables and subdeliverables. This lets you group tasks and roll up summary bars.
Step 2: List the activities (tasks)
Under each WBS element, you list measurable activities (and milestones). Each must have clear start and end constraints (even if soft). Avoid vague tasks.
Step 3: Estimate durations & assign calendars
Assign durations, based on experience, resource capacity, or historical data. Also, assign which calendar (global, project, resource) governs each activity’s working days.
Step 4: Define dependencies (predecessors & successors)
Every activity (except the start milestone) should have at least one predecessor, and ideally one successor. In Primavera you specify dependency types (FS, SS, FF, SF). Once all are tied, you run schedule (F9) to compute the dates.
Step 5: Review & baseline the schedule
After scheduling, review for any anomalies or illogical timing. Then, set a baseline (or multiple baselines) so you have a frozen copy to compare actuals against.
Step 6: Display & refine the Gantt layout
Open the Activities view with Gantt. Configure the layout: show or hide columns, color bars, set timescale, display baselines. Use shading and visual cues to improve readability.
Step 7: Update & monitor progress
As work proceeds, you update percent complete, adjust dates, and re-schedule. The Gantt chart will automatically reflect delays, float consumption, and critical path shifts.
Throughout this process, Primavera’s Gantt chart is your live interface for planning, controlling, and communicating.
4. Best Practices for Effective Primavera Gantt Charts
A Gantt chart is only as useful as its design and discipline. To maximize value, follow these best practices.
4.1 Keep clarity & avoid clutter
Large projects can make Gantt charts chaotic. Use filters, collapse WBS levels, or show only summary tasks where appropriate. Let detail come out only when needed.
4.2 Use consistent color scheme & bar styles
Define a scheme (for critical, non-critical, baseline) and reuse it. That helps stakeholders understand visuals immediately.
4.3 Show baseline and current simultaneously
Expose both baseline and current bars so variances are visible. Primavera supports secondary baseline display.
4.4 Shade non-work time appropriately
Enable non-work shading (weekends, holidays) so the Gantt does not mislead.
4.5 Use well-defined dependencies
Avoid chains of “start to finish” failures or chains that mask float. Prefer clear dependencies that reflect actual logic over artificial linking.
4.6 Limit the number of open activities in view
Don’t try to display every task at once. Use lookahead filters (e.g. next 3 months) or collapse older phases.
4.7 Update consistently & compare to baseline
Frequent updates—even partial—ensure your Gantt stays relevant. Use variance reports, critical path checks, and date comparisons.
4.8 Print or export smartly
Use layout settings to ensure your Gantt chart prints cleanly. Fit to width, set margins, and choose proper timescale windows.
These practices make your Primavera Gantt chart a tool of insight, not confusion.
5. Common Challenges & How to Avoid Them
Even with a powerful tool like Primavera, Gantt charts can mislead or break down if misused. Here are challenges to watch for—and how to address them.
5.1 Overcomplex dependencies
If you chain dozens of dependencies, float becomes meaningless and the Gantt loses readability. Simplify logic and avoid unnecessary linking.
5.2 Misleading float usage
Users often misinterpret float. Activities may appear “non-critical” because of float, but delays in float may ripple. Always monitor float consumption.
5.3 Too many baseline bars
Displaying multiple baselines simultaneously can clutter the chart. Use only the necessary baselines (primary + one scenario) and limit overlap.
5.4 Failing to shade non-work time
If shading is off, the Gantt may wrongly imply work on weekends or holidays. Always configure the correct calendar.
5.5 Scale misalignment
If your timescale is too coarse, you lose detail; too fine, and the Gantt becomes unreadable. Adjust scale dynamically based on context.
5.6 Ignoring progress variance
If you don’t monitor deviations between planned vs actuals, your Gantt becomes stale. Compare baseline vs actual in each update.
5.7 Printing distortions
When exporting, misfit timescales or improperly set margins may squash your view. Always preview, fit timescale width, and adjust start/finish offsets.
By anticipating these pitfalls, you keep your Gantt chart in Primavera both usable and credible.
Conclusion
Gantt Charts in Primavera remain one of the most powerful visual tools in project management. When used within Primavera, they become far more than static bar graphs—they evolve into living, interactive schedule maps. With correct setup, frequent updates, and smart layout choices, a Primavera Gantt chart shows you at a glance where your project stands, where risk lies, and where adjustments are needed.
If you’d like, I can also provide sample Primavera layouts, screenshots, or even a template you can start with. Would you like me to extend this blog into a ready-to-post format with images and SEO elements?

