")
Decoding Loop Diagrams: The Core of Efficient Industrial Control Systems
In modern industrial automation and control systems, precision, clarity, and coordination are crucial. Every control engineer, designer, and technician depends on detailed documentation to ensure systems function safely and efficiently. Among these essential documents, the Industrial Loop Diagram Guide stands as a cornerstone for understanding, troubleshooting, and maintaining control loops.
Industrial Loop Diagram Guide
But what exactly is a Industrial Loop Diagram Guide. Why is it so important in instrumentation and control engineering? More importantly, how can one create an accurate and effective loop diagram?
This article dives deep into these questions. You’ll learn what a loop diagram is, its purpose, key components, and how to create one step by step. Whether you’re a beginner in instrumentation or an experienced engineer refining your documentation skills, this comprehensive guide will help you understand every aspect of loop diagrams in detail.
1. Understanding the Essence of a Loop Diagram
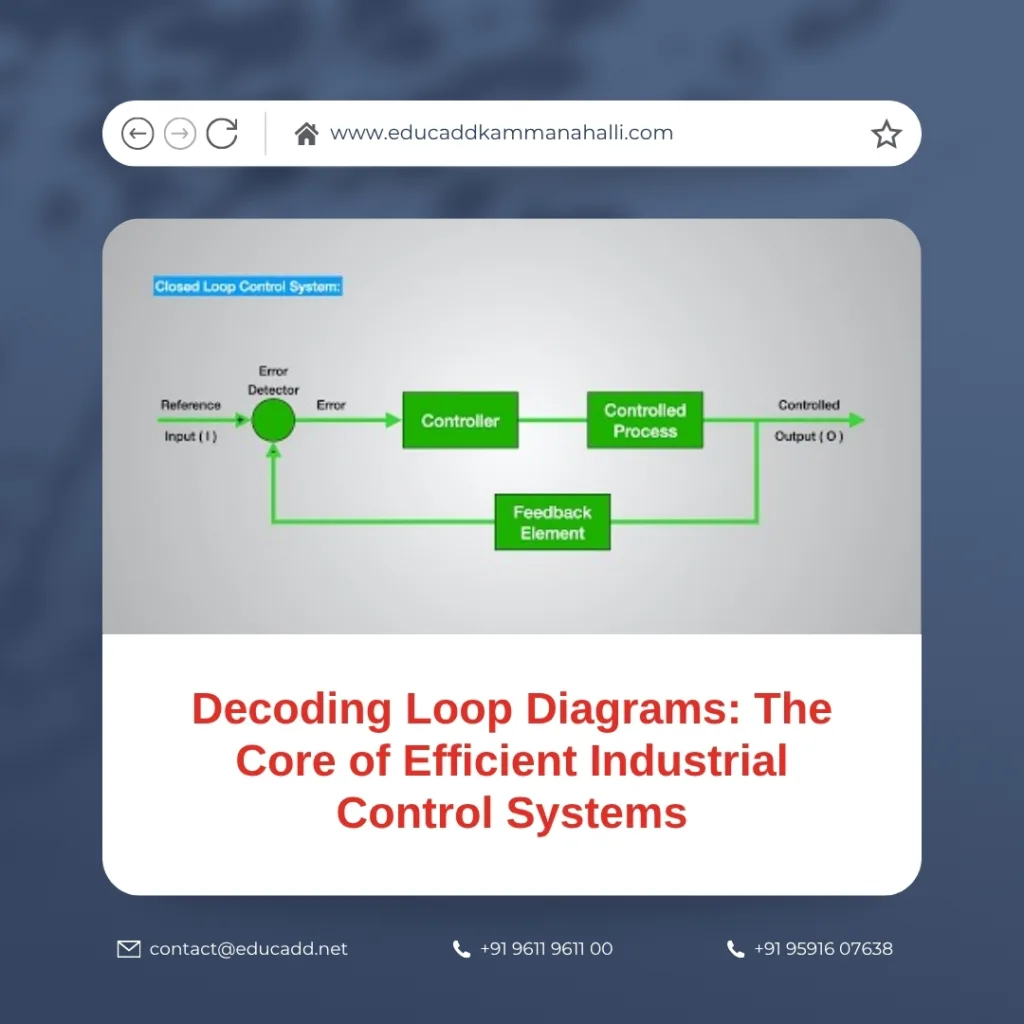
A loop diagram is a detailed drawing that represents the complete control loop of an instrumentation or process control system. It connects the field instruments, control devices, junction boxes, marshalling panels, and the control room interface—illustrating how signals travel throughout the system.
Essentially, a loop diagram acts like a map for signal flow. It shows how each component interacts, how wires are connected, and how signals are transmitted, processed, and returned to control the desired output.
In process industries such as oil and gas, chemical, power generation, and manufacturing, engineers rely on loop diagrams for installation, commissioning, maintenance, and troubleshooting activities. These diagrams provide clarity and consistency, ensuring every professional working on the system can interpret the control logic without confusion.
Let’s look at the core characteristics of a loop diagram:
-
It represents one complete control loop, from the measuring instrument to the control system.
-
It includes all wiring details, terminal numbers, and instrument tag numbers.
-
It shows signal types such as 4–20 mA current loops, pneumatic signals, or digital communications.
-
It defines interconnections among devices, junction boxes, and control panels.
-
It helps verify the accuracy of installation before system start-up.
In simple terms, a loop diagram is not just a schematic. It is a technical blueprint that translates a control philosophy into actionable wiring details.
2. Why Loop Diagrams Matter in Industrial Projects
Creating a loop diagram might seem like an extra step in project documentation, but in reality, it is one of the most critical parts of the design process. It bridges the gap between concept and implementation.
Here’s why loop diagrams are indispensable in industrial automation and instrumentation projects:
a. Precision and Accuracy
Loop diagrams eliminate guesswork by defining the exact wiring and connection details for each loop. This ensures every sensor, transmitter, controller, and actuator is properly integrated into the control system.
b. Simplifies Installation and Commissioning
When technicians begin installing instruments in the field, they rely heavily on loop diagrams. The diagram shows them exactly where each cable terminates, which terminal numbers to connect, and how signals are routed through junction boxes or panels.
c. Enhances Troubleshooting Efficiency
In the event of signal failure or equipment malfunction, loop diagrams become the first reference point. By tracing the signal path on the diagram, maintenance teams can quickly identify the source of error—whether it’s a wiring issue, device fault, or configuration error.
d. Facilitates System Integration
Loop diagrams provide a clear visual of how each subsystem communicates with others. This becomes vital when integrating complex systems such as PLCs, DCS, SCADA, and smart instrumentation.
e. Ensures Safety and Compliance
Accurate loop documentation helps organizations comply with international standards like ISA, IEC, and ISO. It also minimizes risks by ensuring correct grounding, shielding, and interlocks.
In short, without loop diagrams, the control system would be a black box—hard to understand and even harder to maintain.
3. Key Elements and Symbols in a Loop Diagram
Before creating a loop diagram, it’s essential to understand its main components and how they’re represented. Every symbol and notation has a defined meaning that must align with industry standards, such as ISA S5.4.
Here are the major elements found in a typical loop diagram:
a. Instrument Tag Number
Each instrument in a loop is assigned a unique identification code known as the tag number. For example, a temperature transmitter might be labeled as TT-101. This tag links the device to process drawings, equipment lists, and control logic.
b. Signal Path
This shows how signals flow from the field device to the control system and back. The path can be analog, digital, or pneumatic, and it’s usually indicated by distinct line types or arrowheads showing direction.
c. Junction Boxes and Marshalling Panels
These are connection points where multiple cables terminate. Loop diagrams show terminal numbers for both field and panel sides, ensuring proper termination during wiring.
d. Power Supply and Grounding
Each active device needs a power source. Loop diagrams display where power is supplied from and how grounding or shielding is handled to avoid electrical noise.
e. Control System Interface
This section includes PLC or DCS input/output cards, showing the exact terminal numbers and channel assignments corresponding to the field instruments.
f. Standard Symbols
Symbols such as transmitters, indicators, control valves, and switches are represented using standard ISA symbols. This ensures that engineers across different regions can interpret the same diagram consistently.
4. Step-by-Step Process to Create a Loop Diagram
Creating a loop diagram requires attention to detail, logical sequencing, and adherence to standards. Here’s a structured approach to help you create one effectively:
Step 1: Gather Instrumentation and Control Data
Start by collecting all relevant project documents. This includes the Piping and Instrumentation Diagram (P&ID), instrument index, I/O list, and control philosophy. These documents define which instruments belong to which loops and how they interact.
Step 2: Identify Loop Numbers
Assign a unique loop number to each control loop. For instance, if a pressure control loop is associated with tag numbers like PT-201, PY-201, and PCV-201, they all belong to Loop 201.
Step 3: Define Signal Flow
Determine how signals move through the loop—from the field transmitter to the controller and then to the final control element. Indicate if the signal is analog 4–20 mA, digital, or pneumatic.
Step 4: Add Device Details
For each device, mention the tag number, model, and manufacturer details. Include connection terminals, wire colors, and cable references if required.
Step 5: Draw Wiring and Termination Details
Represent each wire with a unique cable number. Show its connection from the field device to the junction box, from the junction box to the marshalling panel, and finally to the control system terminal.
Step 6: Incorporate Power Supply and Shielding
Indicate how each instrument is powered and where cable shielding is grounded. Proper grounding avoids signal interference and ensures system reliability.
Step 7: Cross-Check with P&ID
After completing the loop diagram, verify that all instruments and connections align with the P&ID. Every signal shown in the loop must have a counterpart on the process diagram.
Step 8: Review and Approve
Finally, review the drawing for accuracy, compliance, and clarity. Once verified by engineering and QA teams, the loop diagram becomes an official project document ready for construction and maintenance use.
5. Best Practices and Modern Tools for Loop Diagram Creation
With industrial automation advancing rapidly, loop diagram creation has also evolved from manual drafting to intelligent software-based documentation. Following best practices ensures quality, consistency, and future scalability.
a. Use Standardized Templates
Always follow ISA or IEC standards for symbol representation and tag numbering. Consistency avoids confusion across different project phases.
b. Adopt Smart Documentation Tools
Software like AutoCAD Electrical, SmartPlant Instrumentation (SPI), EPLAN, and AVEVA allows engineers to automate diagram creation. These tools link data from the instrument index and automatically generate loop drawings.
c. Maintain Revision Control
Each modification in instrumentation or wiring should be tracked through a formal revision system. Always indicate the latest revision number, date, and reason for change.
d. Integrate with Control System Databases
In modern projects, loop diagrams are often linked to control system databases or asset management software. This integration helps in seamless updates when hardware configurations change.
e. Focus on Clarity
A clear and neatly arranged loop diagram communicates more effectively than a cluttered one. Maintain uniform spacing, label wires properly, and avoid overlapping lines.
f. Digital Loop Diagrams for Industry 4.0
With smart plants adopting digital twins and predictive maintenance systems, digital loop diagrams are gaining importance. These interactive diagrams allow real-time access to device data, calibration records, and maintenance history.
By combining these practices with technology, organizations can transform traditional documentation into dynamic engineering assets.
Conclusion: The Backbone of Reliable Control Systems
A Industrial Loop Diagram Guide may seem like just another technical drawing, but in truth, it’s the foundation of efficient, safe, and maintainable control systems. From design to daily operations, it ensures every connection, signal, and device works in perfect synchronization.
Understanding what a loop diagram is and how to create one not only enhances engineering precision but also boosts productivity and reduces downtime in industrial environments.
As industries move toward smarter automation and digital control, mastering loop diagram creation will remain an invaluable skill for engineers, technicians, and system designers alike.

