")
Decoding the Activity Network Diagram: Master the Logic Behind Project Flow
In the fast-paced world of project management, keeping activities organized and timelines realistic is a challenge. An Activity Network Diagram Logic bridges this gap by visually mapping every task, its sequence, and dependencies. This diagram is not just a chart — it’s a logic-driven roadmap that helps teams deliver results on time.
Activity Network Diagram Logic
Whether you are a project manager, engineer, or student, understanding the logic behind an Activity Network Diagram will sharpen your planning skills. This guide dives deep into its structure, benefits, creation process, and real-world applications. By the end, you’ll see why this tool is indispensable in managing complex projects efficiently.
1. What is an Activity Network Diagram?
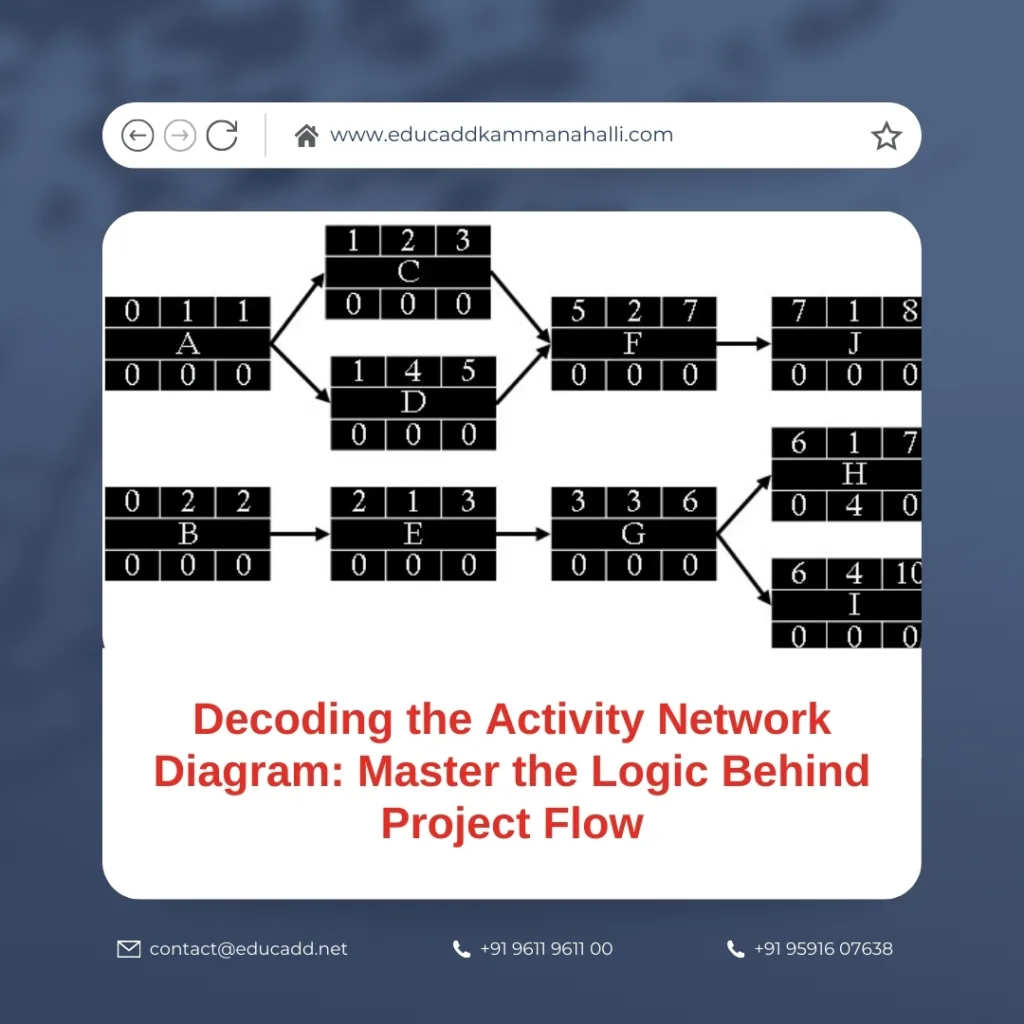
An Activity Network Diagram is a graphical representation of a project’s tasks and their logical relationships. It uses nodes to represent activities and arrows to show the sequence. Each connection tells you which tasks must be completed before others can begin.
Unlike basic task lists, this diagram reveals interdependencies clearly. This means you can quickly identify the critical path — the sequence of tasks that determine the shortest possible project duration. In many industries, from construction to IT, this method is a go-to for managing complexity.
Moreover, it eliminates guesswork. When every team member sees the flow of work, they can align their efforts with the overall timeline. In short, the Activity Network Diagram brings clarity to even the most complicated schedules.
2. The Core Logic Behind the Diagram
The magic of the Activity Network Diagram lies in its logic. It operates on the principle that some activities cannot start until others are finished. This simple yet powerful rule forms the backbone of accurate scheduling.
At its core, the diagram answers three vital questions:
-
What needs to be done?
-
In what order should it be done?
-
How long will it take?
The logical flow often starts with initial activities that have no predecessors. These feed into dependent tasks, creating a chain. Arrows define precedence, ensuring no step is overlooked.
Here’s where critical path analysis becomes vital. By highlighting the longest stretch of dependent activities, the diagram shows the minimum time needed to complete the project. Delays in these tasks will directly impact the final delivery date, making them top priority for managers.
3. Steps to Create an Effective Activity Network Diagram
Creating an Activity Network Diagram is not just about drawing shapes. It’s about structuring a plan that reflects reality. Here’s a step-by-step approach:
Step 1: List All Activities
Start by identifying every task in the project. Even small activities matter because missing one can cause scheduling issues later.
Step 2: Determine Dependencies
Ask which tasks must finish before others can start. This forms the skeleton of the diagram.
Step 3: Estimate Durations
Assign realistic timeframes for each activity. Avoid over-optimistic estimates; accuracy here is key to reliability.
Step 4: Draw the Diagram
Place activities in nodes (circles or rectangles). Use arrows to connect them based on dependencies. Ensure the flow reads logically from left to right.
Step 5: Identify the Critical Path
Analyze the diagram to find the longest chain of dependent tasks. These determine the project’s minimum completion time.
This process not only organizes your project but also surfaces potential bottlenecks early, allowing you to act before they disrupt progress.
4. Advantages of Using an Activity Network Diagram
The Activity Network Diagram offers multiple benefits that go beyond simple scheduling:
Clear Visualization
Complex projects often involve overlapping tasks. The diagram presents these relationships visually, making them easier to understand.
Improved Communication
Team members, stakeholders, and clients can quickly grasp the project’s structure. This transparency reduces confusion and builds trust.
Risk Management
By showing dependencies, the diagram helps you spot high-risk points. You can prepare contingency plans before issues arise.
Better Time Management
Knowing the critical path ensures that priority is given to tasks that directly affect deadlines. This keeps projects on track.
Efficient Resource Allocation
When you see exactly when and where tasks occur, you can allocate resources with precision, avoiding idle time or overload.
These advantages make the Activity Network Diagram more than just a planning tool — it’s a decision-making guide for successful project delivery.
5. Real-World Applications Across Industries
The Activity Network Diagram is not limited to one field. It finds practical use in various industries, including:
Construction Projects
In construction, sequencing tasks like foundation laying, framing, and roofing is critical. The diagram ensures nothing happens out of order.
Software Development
Agile teams use modified versions of activity diagrams to track feature development, testing, and deployment stages.
Event Planning
From conferences to weddings, every event involves tasks that must be perfectly timed. The diagram helps prevent scheduling clashes.
Manufacturing
Production lines rely on strict task orders. Delays in one step can halt the entire line, making dependency mapping essential.
Research and Development
R&D projects involve multiple experiments and analyses. Visualizing these steps ensures research flows smoothly without redundant efforts.
No matter the industry, the diagram’s ability to show logical relationships makes it a universal tool for project success.
Conclusion: Turning Logic into Project Success
Mastering the Activity Network Diagram Logic means mastering the logic of project flow. By laying out tasks in a structured sequence, it gives managers the power to foresee challenges, manage resources wisely, and meet deadlines with confidence.
The beauty of this method is its adaptability. Whether you’re building a bridge, launching a software product, or organizing a community event, the diagram can be customized to fit your needs.
In today’s competitive environment, efficiency is not optional — it’s essential. With the Activity Network Diagram in your toolkit, you’re not just planning projects; you’re engineering success.

