")
Charting Progress in Primavera Reporting: A Clear Approach to Monitoring Project Health
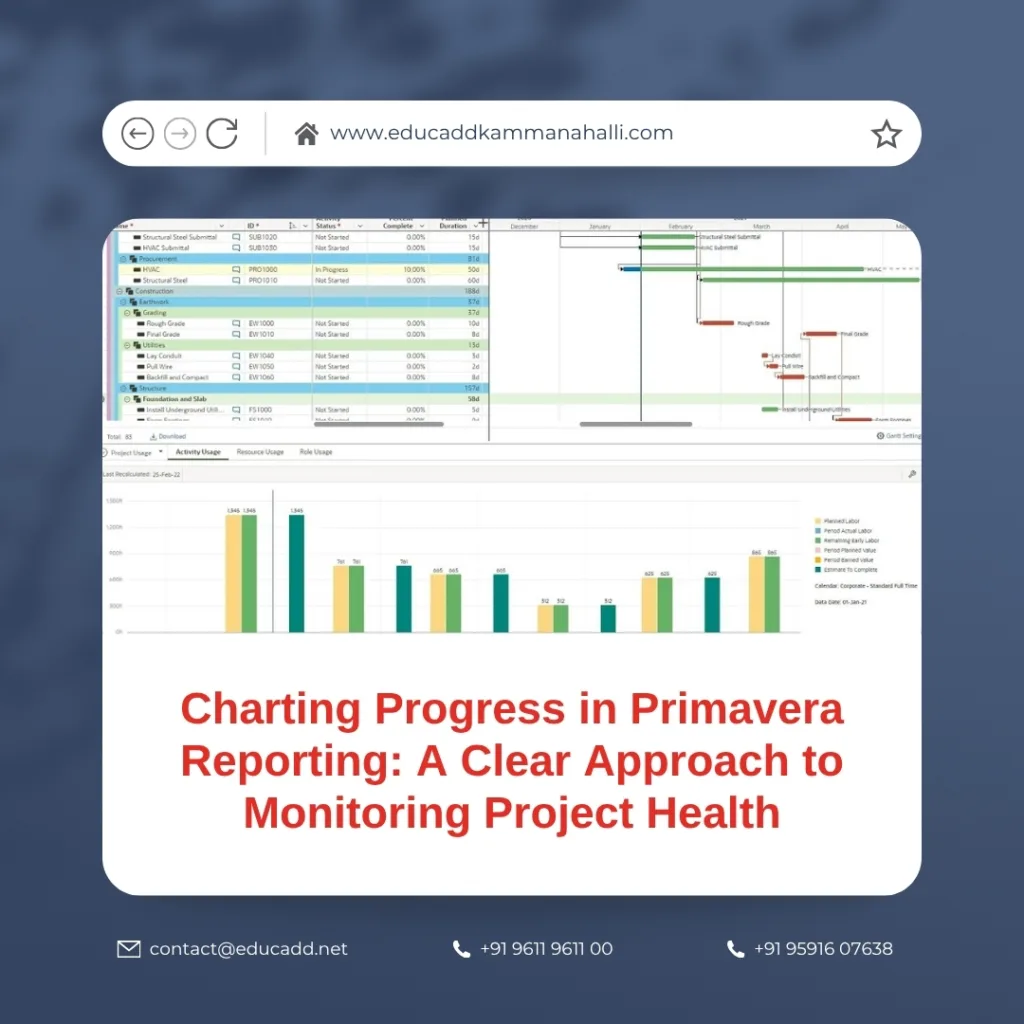
In project management, the difference between success and delays often lies in how well you track progress. With Oracle Primavera, you gain powerful reporting capabilities that help you report project progress accurately, timely, and meaningfully. In this article, I explain how to Primavera project progress tracking, step by step, with concrete methods, tips, and pitfalls. You’ll walk away with a reliable approach to measure and communicate project health effectively.
Primavera project progress tracking
Every project demands transparency—stakeholders expect to see not only where you are today but also how you got here and where you’re going. Primavera project progress tracking reporting offers the infrastructure to turn raw project data into insight. But without a clear approach, reports can become noise: stale numbers, conflicting metrics, and misinterpretation. That’s why a disciplined, consistent method for tracking project progress in Primavera reporting matters.
In what follows, I’ll guide you through:
-
Setting up the foundation: baseline, schedule, and data date
-
Choosing metrics: activity, duration, units, physical, and earned value
-
Implementing updates: steps for progress entry and rescheduling
-
Reporting layouts: dashboards, S-curves, variance reports
-
Best practices: consistency, validation, and stakeholder alignment
Let’s begin.
1. Building the Foundation for Progress Tracking
Before you can meaningfully monitor progress in Primavera, your project must be configured correctly. Skip or under-emphasize these steps and your reports risk being flawed.
Establish a Baseline
A baseline is your reference point: the approved plan against which actuals and forecasts are compared. Without it, your progress figures are floating, with no anchor.
-
In Primavera, go to Project → Maintain Baselines → Add to save a snapshot of your schedule.
-
Use Project → Assign Baseline to bind that reference to your active schedule.
-
Stick to consistent baseline versions (project baseline vs user baseline).
-
Avoid changing activity IDs or reusing them later, which breaks baseline links.
-
The baseline should be locked: changes go through change control, not casual edits.
Once set, you can view baseline bars along with current bars in Gantt views, making deviations visible.
Define the Data Date (Cut-off Date)
The data date (also called the cut-off date) is the point in time up to which progress is measured. All actuals (start, finish, durations) must be logged up until that date.
-
Keep the data date aligned: e.g. weekly, every Saturday at 00:00.
-
Use the Progress Spotlight or a filter to highlight activities impacted by it.
-
Ensure that actual start/finish entries do not exceed the data date.
The data date ensures that all progress enters the same frame of reference; forecasts and remaining durations flow from there.
Structure the Schedule Logically
Your Work Breakdown Structure (WBS) and activity links determine how well progress propagates and how clear your reports become.
-
Break the project into meaningful deliverables in a hierarchical WBS.
-
Use logic links (FS, SS, FF, etc.) purposefully—avoid over-complicated networks that obscure dependencies.
-
Assign resources, costs, and durations thoughtfully.
-
Beware of prematurely linking activities just for convenience; maintain clarity.
If your schedule is logically coherent, progress flows more smoothly, and reporting remains intuitive.
2. Selecting the Right Progress Metrics
In Primavera, there is no “one size fits all” metric. You need to choose or combine methods that reflect the nature of your work. Here are the commonly used metrics:
a) Activity Percent Complete
This measures how far along each activity is, expressed in percent.
-
You enter a percent value (0–100 %) in the “% Complete” field.
-
Suitable when progress is readily known or tracked at activity level.
-
Best used when work is uniform, well-defined, and predictable.
Pros: Simple, intuitive.
Cons: Subjective if not standardized. Misuse can distort aggregate progress.
b) Duration Percent Complete
This metric uses elapsed time relative to total scheduled duration.
-
If an activity is planned for 10 days, and 5 days elapsed, that’s 50 %.
-
Primavera allows updating of remaining duration (if manual) or auto computation (if allowed).
-
Useful when work correlates tightly with time.
Pros: Objective in uniform schedule tasks.
Cons: Doesn’t always align with actual physical work; may mislead if tasks stall early.
c) Units Percent Complete
This is suitable when work is quantifiable in discrete units (e.g. units, quantity, parts).
-
Define units for each activity (e.g. cubic meters of pour, numbers of items).
-
Track actual units completed and compute percent complete.
-
Suitable when units are measurable and meaningful.
Pros: Tied to tangible deliverables.
Cons: Requires discipline, accurate unit tracking, and clear definitions.
d) Physical Percent Complete
Here, progress is measured on the physical manifestation of work—visual inspection, measurement, or verification.
-
Use photos, site measurements, inspection reports.
-
Translate those observations into percentages.
-
Use in fields like construction where visual progress is clearer.
Pros: Real-world reflection of work done.
Cons: Subjectivity, dependency on field data, and potential for error.
e) Earned Value Management (EVM)
EVM is the advanced metric that ties scope, schedule, and cost.
-
Two key values: Planned Value (PV) and Earned Value (EV).
-
Cost Performance Index (CPI) = EV / AC.
-
Schedule Performance Index (SPI) = EV / PV.
-
You can derive variances: Cost Variance = EV – AC, Schedule Variance = EV – PV.
EVM offers a holistic indicator of progress that adjusts for cost and schedule simultaneously. It’s powerful but requires disciplined input and understanding.
Each method has a role. Often, you’ll adopt a hybrid approach: for some tasks, use units; for others, physical or duration. The key is consistency and clarity.
3. Updating Progress in Primavera: Step-by-Step
Tracking is only valuable if updates are timely, accurate, and controlled. Here’s a robust seven-step approach derived from expert practices. proove.eu
Step 1: Confirm Baseline Assignment
Before inserting any actuals, verify that the baseline is assigned and visible. That ensures that when you compare, bars align.
Step 2: Collect Progress Data from Field / Teams
Gather actual start/finish dates, quantity reports, inspection notes, and percentage estimates from field teams. Use a clear input template. Distinguish:
-
Actual start / finish dates
-
Percent complete (by method adopted)
-
Units or quantities where applicable
-
Any delays or deviations
Ensure that data is as of or before the cutoff (data date).
Step 3: Enter Actuals in Primavera
Update fields in this sequence for clarity:
-
Activity Status (e.g. Not Started, In Progress, Finished)
-
Actual Start / Actual Finish
-
% Complete (or units/physical)
-
Remaining duration (if manual) or allow the system to recalc
-
Any cost or resource actuals (if tracked)
Avoid entering future dates beyond the data date. Keep logic and constraints in mind.
Step 4: Reschedule from Data Date
Once inputs are in, reschedule (often F9). Primavera will recalc the remaining part of the plan from the data date forward. Make sure scheduling options for out-of-sequence work or logic override are set as preferred. proove.eu
Step 5: Review and Sanity Check
Don’t accept the schedule blindly:
-
Check logic consistency (predecessors, lag, float).
-
Spot anomalies: activities starting after the data date, negative float.
-
Confirm that variances make sense relative to field reality.
-
Adjust forecasted finish dates if needed, but document reasons.
Step 6: Generate Progress Reporting Layouts
Produce visual and tabular views:
-
Gantt with baseline vs current
-
Progress lines (to see ahead/behind)
-
S-curves (actual vs planned)
-
Variance tables
-
Milestone status summaries
-
Dashboard summaries with key metrics
These layouts help convert raw data into insight.
Step 7: Analyze & Act
Use reports to drill into trouble spots:
-
Why is activity X behind?
-
Are resources misallocated?
-
Are dependencies causing ripple effects?
-
What mitigation can you apply?
-
Reforecast future work if adjustments are needed
The true value is in turning observation into corrective action.
4. Reporting Layouts to Communicate Insightfully
How you present progress often matters as much as what you measure. Let’s explore key Primavera reporting formats.
Gantt + Baseline Bars + Progress Line
This is the classic visual:
-
Baseline bar: where you planned
-
Current bar: where you are
-
Progress line (data date): shows the cut-off
-
Activities left or delayed show immediately which paths are slipping
You can color-code bars (complete, in progress, not started) to improve clarity. Use the Progress Line function to highlight early/late tasks.
S-Curves (Cumulative Curves)
S-curves show cumulative planned vs actual work over time.
-
On the horizontal axis: time
-
On the vertical: cost, units, or percentage
-
A divergence between curves signals deviation
-
You can forecast completion by trend lines
S-curves help stakeholders see where the project is accelerating or decelerating.
Variance & Performance Tables
These tables list:
-
Activity ID / name
-
Planned Value, Earned Value, Actual Cost
-
SV, CV, SPI, CPI
-
% Complete, forecasted finish, delays
These let you analyze which tasks contribute most to variances and whether you are on track financially and temporally.
Milestone Status Reports
A distilled view of key checkpoints:
-
Milestone name, planned date, actual date, status
-
Color coding (e.g., green = met, amber = at risk, red = missed)
-
A quick summary for executives to see major deliverables
Dashboards
Configure dashboards with key widgets:
-
Overall percent complete
-
Top delays (by float)
-
EVM performance indicators
-
Milestone charts
-
Look-ahead tasks
-
Resource consumption gauge
Dashboards give an instant pulse of where the project stands.
Conditional Formatting & RAG (Red/Amber/Green)
Use user-defined fields or activity status fields to auto color bars: red for delayed, amber for risk, green for on track. Tools like OnePager can import Primavera output and apply RAG formatting. onepager.com
5. Best Practices & Common Pitfalls
When tracking project progress in Primavera reporting, the discipline matters. Here are best practices and warnings.
Maintain Consistency
-
Use the same metric method for an activity category across reports (don’t mix).
-
Stick to the same cutoff schedule (e.g. weekly, every Friday).
-
Update in the same sequence (status, dates, percent, remaining).
-
Use templates for input and reports to reduce variance.
Verify Data Accuracy
-
Cross-check field reports vs system entries.
-
Validate percent assignments (don’t overstate).
-
Confirm units and quantities with site measurement.
-
Flag and resolve anomalies like start dates post data date.
Avoid Overwriting the Baseline
-
Never update the baseline casually.
-
Use user baselines if you need to capture snapshots for comparison.
-
Lock your main baseline.
Handle Out-of-Sequence Logic Carefully
When activities progress in unexpected order, logic may break. Primavera options like Retain Logic, Progress Override, or Actual Dates help. Decisions here affect the schedule significantly. proove.eu
Use a “Look-Ahead” Filter
Show only activities with Remaining Early Start within some window (e.g. 4–12 weeks ahead). This helps focus stakeholders and avoids clutter. proove.eu
Document Exceptions & Rationale
Whenever you adjust forecasts, durations, or logic, log the reason. This aids traceability and stakeholder trust.
Review Trends, Not Snapshots
One report is a snapshot; trends over multiple reporting cycles reveal patterns. Use historical data to gauge acceleration or decline.
Engage Stakeholders with Clear Visuals
Don’t throw raw tables at executives. Use dashboards, red/amber/green cues, highlight critical variances. Add narrative commentary that clarifies root causes, not just numbers.
Conclusion
Effective progress tracking in Primavera project progress tracking goes beyond entering data or generating colorful charts—it’s about transforming numbers into strategic insights. When used correctly, Primavera becomes a control center that reflects true project performance, not just planned versus actual metrics.
By maintaining accurate baselines, consistent update cycles, and clear performance indicators, project managers can detect slippages early, realign schedules, and maintain stakeholder confidence. Moreover, integrating visuals such as S-curves, variance tables, and dashboards ensures every report tells a clear story—where the project stands, why deviations occur, and how to steer it back on track.

