")
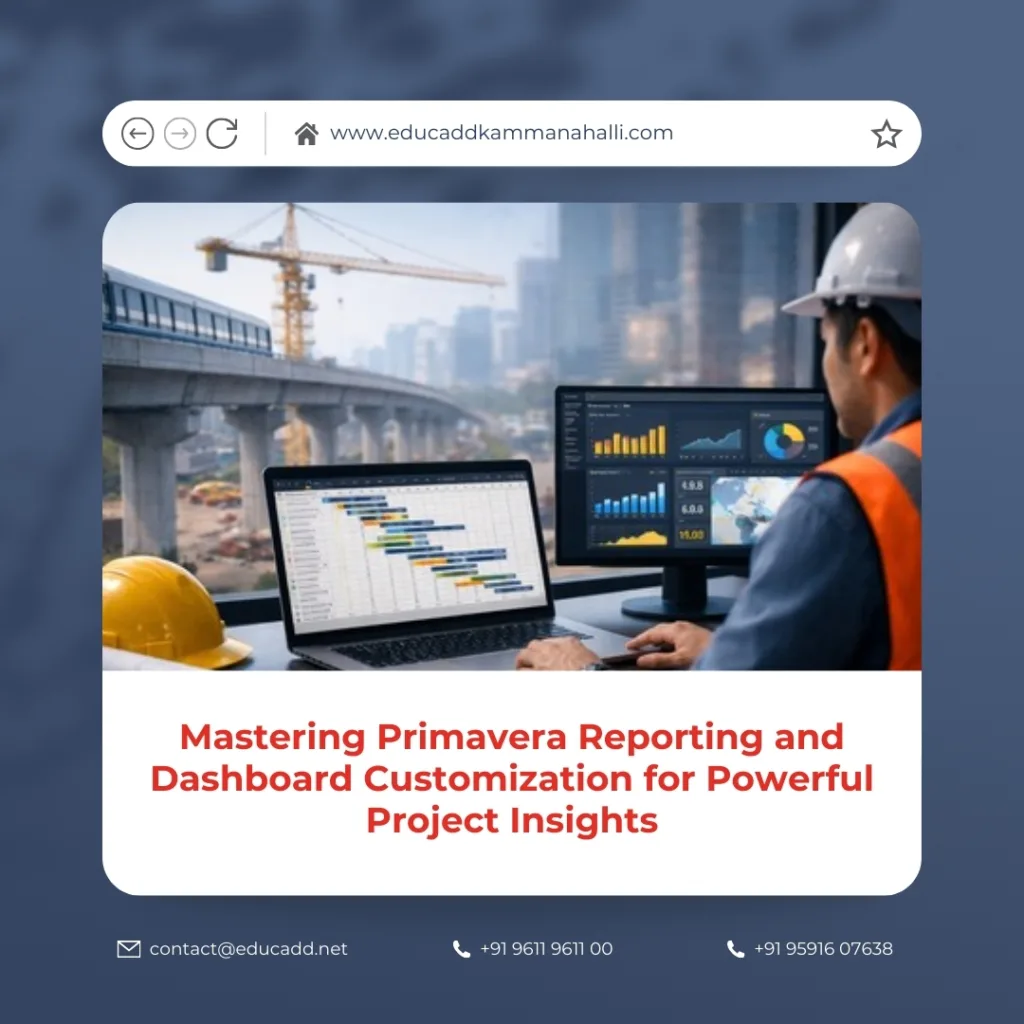
Mastering Primavera Reporting and Dashboard Customization for Powerful Project Insights
Modern project management relies heavily on accurate data, clear insights, and timely reporting. In complex industries such as construction, engineering, manufacturing, and infrastructure development, project managers often deal with vast amounts of scheduling data. This is where Primavera Reporting Dashboard Customization becomes extremely valuable. By transforming raw scheduling data into meaningful reports and visual dashboards, organizations can monitor project progress, identify potential risks, and make informed decisions faster.
Primavera is widely recognized as one of the most powerful project management tools available today. While many professionals use it for scheduling and resource planning, its reporting and dashboard capabilities are often underutilized. With the right customization techniques, Primavera can deliver real-time project intelligence that helps teams stay aligned and productive.
Primavera Reporting Dashboard Customization
Customized dashboards allow managers to focus on the most relevant project metrics without spending hours analyzing complex data tables. Instead of manually compiling reports, teams can automate insights that highlight schedule delays, cost deviations, and performance indicators. As a result, organizations gain improved transparency and better control over project outcomes.
This article explores how Primavera Reporting Dashboard Customization can enhance project management efficiency. It explains key concepts, benefits, tools, strategies, and best practices that enable professionals to build powerful reporting systems within Primavera.
Understanding Primavera Reporting Capabilities
Primavera offers a comprehensive reporting framework designed to convert scheduling data into structured insights. Reports generated within the system provide a clear overview of project timelines, resource allocation, costs, and progress status. These reports can be customized to suit the specific needs of different stakeholders, including project managers, executives, planners, and clients.
One of the most important aspects of reporting in Primavera is flexibility. The platform allows users to create tabular reports, graphical reports, and performance summaries. This flexibility ensures that both technical teams and decision-makers can interpret project data easily.
Reports can include information such as activity status, resource utilization, schedule variance, and milestone tracking. By presenting this information in a structured format, Primavera enables teams to evaluate project health quickly and identify areas requiring attention.
Effective reporting is not only about presenting data but also about highlighting meaningful insights. When users design reports carefully, they can track trends, detect delays early, and ensure that project goals remain achievable.
Importance of Dashboards in Project Management
Dashboards play a critical role in modern project environments because they provide visual summaries of project performance. Instead of reading long spreadsheets or reports, managers can view essential metrics through charts, graphs, and indicators displayed in one place.
When Primavera Reporting Dashboard Customization are implemented effectively, dashboards become powerful decision-making tools. They allow stakeholders to monitor key performance indicators such as schedule performance, resource efficiency, and project progress.
Dashboards also improve communication within project teams. Visual data makes it easier for everyone to understand the current status of the project and collaborate on solutions when problems arise.
Another advantage of dashboards is real-time monitoring. Project managers can track progress continuously and respond quickly to unexpected changes or delays.
Key Components of Primavera Reporting Systems
A well-structured reporting system in Primavera typically includes several important components. Each component contributes to the overall clarity and usefulness of project information.
Reports often begin with activity data, which includes details about tasks, durations, dependencies, and completion percentages. Resource information is also integrated to show how workforce and materials are allocated across the project schedule.
Cost tracking is another critical element of reporting. Primavera allows users to monitor budget usage and compare planned costs with actual expenditures.
Additionally, milestone tracking helps organizations evaluate whether major project targets are being achieved on time.
These components work together to provide a complete view of project performance, ensuring that managers have the information required to guide projects successfully.
Benefits of Primavera Reporting and Dashboard Customization
Organizations gain significant advantages when they implement Primavera reporting and dashboard customization strategies. Customized dashboards transform complex scheduling data into actionable insights that improve decision-making.
One major benefit is improved visibility. Stakeholders can easily understand project status without analyzing detailed schedules. This clarity enables faster responses to challenges and reduces the risk of delays.
Another advantage is efficiency. Automated reports eliminate the need for manual data compilation, saving valuable time for project managers and planners.
Customization also allows companies to tailor dashboards for different roles. Executives may focus on strategic metrics, while planners may require detailed schedule analysis.
• Faster identification of schedule risks and delays
• Improved communication across project teams
These benefits collectively enhance project performance and strengthen overall management capabilities.
Customizing Reports to Match Business Needs
Every organization manages projects differently, which means reporting requirements can vary significantly. Primavera provides numerous customization options that allow users to tailor reports to match their operational needs.
Users can select specific fields, filters, and layouts when designing reports. This flexibility ensures that only relevant information appears in the final output. By eliminating unnecessary data, reports become easier to interpret.
Customization also enables companies to align reports with internal reporting standards. For example, organizations may create templates that highlight progress indicators, cost summaries, and schedule forecasts.
When reporting structures reflect real business priorities, project teams can analyze data more effectively and take corrective action when needed.
Designing Effective Primavera Dashboards
An effective dashboard should present information clearly while focusing on the most critical project indicators. Overloading dashboards with excessive data can reduce their usefulness and confuse viewers.
When building dashboards, users should prioritize metrics that directly influence project performance. Examples include schedule variance, resource utilization, and milestone completion rates.
Visual elements such as charts, graphs, and progress bars enhance readability and allow users to identify trends quickly. Color coding can also highlight areas that require attention.
Successful dashboards combine clarity, simplicity, and relevance. When these elements are balanced properly, dashboards become valuable tools for daily project monitoring.
Integrating Data Sources for Better Reporting
Modern project environments often rely on multiple software systems, including cost management tools, ERP platforms, and resource planning applications. Integrating these data sources with Primavera significantly improves reporting capabilities.
By combining information from different systems, organizations can generate comprehensive project reports that cover scheduling, budgeting, and resource performance simultaneously.
Integrated data ensures that dashboards present a unified view of project progress. Instead of analyzing disconnected reports, managers can evaluate all critical metrics within one interface.
This integration also improves data accuracy. When information flows automatically between systems, the risk of manual reporting errors is greatly reduced.
Monitoring Project Performance Through Dashboards
Dashboards are particularly useful for tracking project performance indicators in real time. They allow managers to measure progress against predefined goals and detect deviations quickly.
Performance metrics typically include schedule performance index, cost performance index, and activity completion rates. These indicators help managers understand whether projects are progressing according to plan.
Real-time monitoring ensures that project teams remain proactive rather than reactive. Instead of discovering issues after they escalate, managers can address them immediately.
When performance metrics are visualized clearly, project teams gain a deeper understanding of operational trends and can improve planning strategies for future projects.
Improving Decision-Making with Visual Analytics
Visual analytics is one of the most powerful features of modern project dashboards. By presenting data through graphs and charts, Primavera helps users interpret complex scheduling information more easily.
Decision-makers often rely on visual indicators to evaluate project status quickly. For example, trend charts can reveal whether delays are increasing or decreasing over time.
Visual analytics also supports strategic planning. When managers observe patterns in project performance, they can adjust resource allocation or scheduling approaches accordingly.
Effective visual dashboards transform raw project data into insights that guide smarter and faster decisions.
Best Practices for Primavera Dashboard Development
Developing effective dashboards requires careful planning and a clear understanding of project requirements. Several best practices can help organizations create dashboards that deliver maximum value.
First, dashboards should focus on key performance indicators that directly impact project outcomes. Including too many metrics can reduce clarity and distract from essential information.
Second, dashboards should be designed with the end user in mind. Executives, planners, and team members may require different views of project data.
Finally, dashboards should be updated regularly to ensure that information remains accurate and relevant.
• Focus on a limited number of high-impact metrics
• Ensure dashboards are simple and visually clear
By following these practices, organizations can create dashboards that improve project visibility and decision-making.
Automating Primavera Reports for Efficiency
Automation is a major advantage of modern reporting systems. Primavera allows users to schedule reports that generate automatically at specific intervals.
Automated reporting reduces the administrative workload for project managers. Instead of manually preparing reports each week, the system delivers updated insights directly to stakeholders.
Automation also ensures consistency in reporting formats. Every report follows the same structure, making it easier to compare project performance over time.
When organizations implement automated reporting processes, they improve efficiency while maintaining accurate and reliable project information.
Common Challenges in Dashboard Customization
Although Primavera reporting and dashboard customization offer numerous advantages, organizations may encounter challenges during implementation. One common issue is data overload. When dashboards contain too many metrics, users may struggle to identify the most important insights.
Another challenge involves data accuracy. If project schedules are not updated regularly, dashboard information may become outdated. Maintaining consistent data entry practices is therefore essential.
Technical limitations can also affect customization efforts, particularly when integrating external systems. However, these challenges can be addressed through careful planning and training.
By recognizing potential obstacles early, organizations can implement reporting systems that remain effective and reliable.
Future Trends in Primavera Reporting Technology
Project management technology continues to evolve rapidly, and reporting tools are becoming increasingly advanced. Artificial intelligence and predictive analytics are expected to play a larger role in Primavera reporting systems in the future.
Predictive dashboards may soon analyze historical project data to forecast potential delays or resource shortages. These insights will help managers take preventive actions before problems occur.
Cloud-based collaboration is another emerging trend. With cloud integration, project teams can access dashboards and reports from anywhere, improving communication and coordination.
As these technologies continue to develop, Primavera Reporting Dashboard Customization will become even more powerful and essential for modern project management.
Conclusion
Effective project management requires more than just scheduling tasks and allocating resources. It also demands clear insights into project performance, risks, and progress. Primavera Reporting Dashboard Customization provide the tools needed to transform complex project data into meaningful information that supports better decision-making.
By designing customized reports and visual dashboards, organizations can monitor key performance indicators, detect potential issues early, and maintain transparency across project teams. These reporting systems simplify data analysis and ensure that stakeholders receive accurate updates about project status.
As project environments become increasingly complex, the ability to visualize and interpret data will continue to grow in importance. Companies that invest in advanced reporting strategies will gain stronger control over their projects and improve overall efficiency.
Ultimately, Primavera dashboards and reporting tools empower professionals to manage projects with greater confidence, clarity, and precision.

